This piece starts an analysis series on the Whatcom County 2014 voter database. All pieces are under construction and subject to further edits in conclusion and data as the registration season progresses toward the General Election. A technical blog that references code and statistical issues is here. The Whatcom County Voter database experiences continual flux and change for causes multivariate; this appears to be especially true in the last five election years. I have discussed "voter churn" in other posts (1,2). WA is an ERIC state. I will have further discussion of this year's ERIC cleansing. Also a discussion of precincts with poor 2013 turnout is here. -RMF
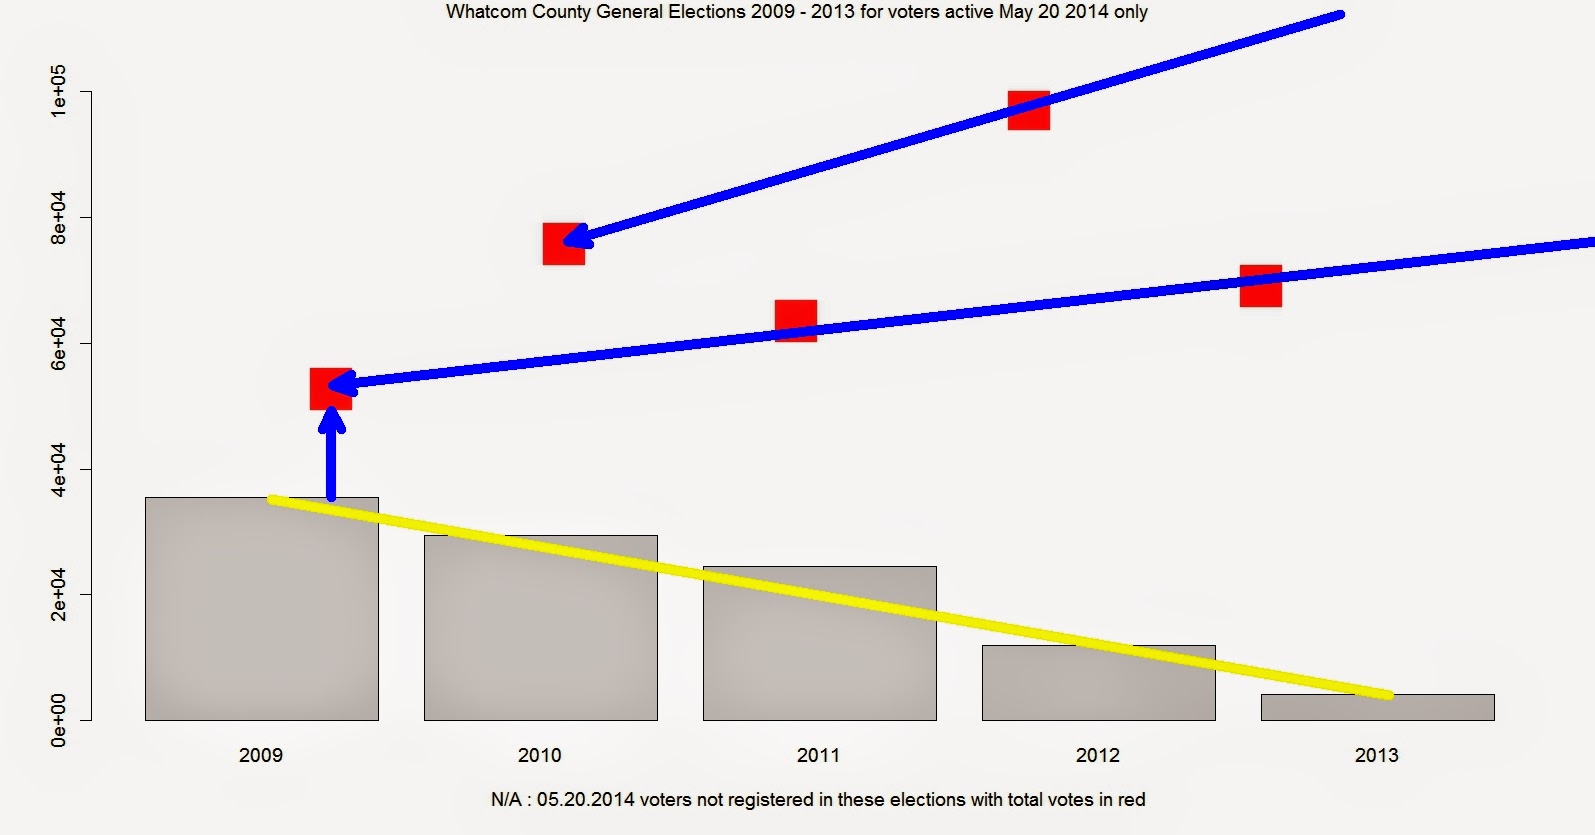
The technical for this piece can be found here. The charts below explicate five years of general election in Whatcom County for voters registered as of May 20,2014. This means that we are looking at election turnout numbers only for those people currently registered to vote as of May 20th, 2014. As of May 20th, the voter database for Whatcom County stood at 126283 registered voters. I duplicate four sets of graphs with analysis. Click on these graphs to enlarge.
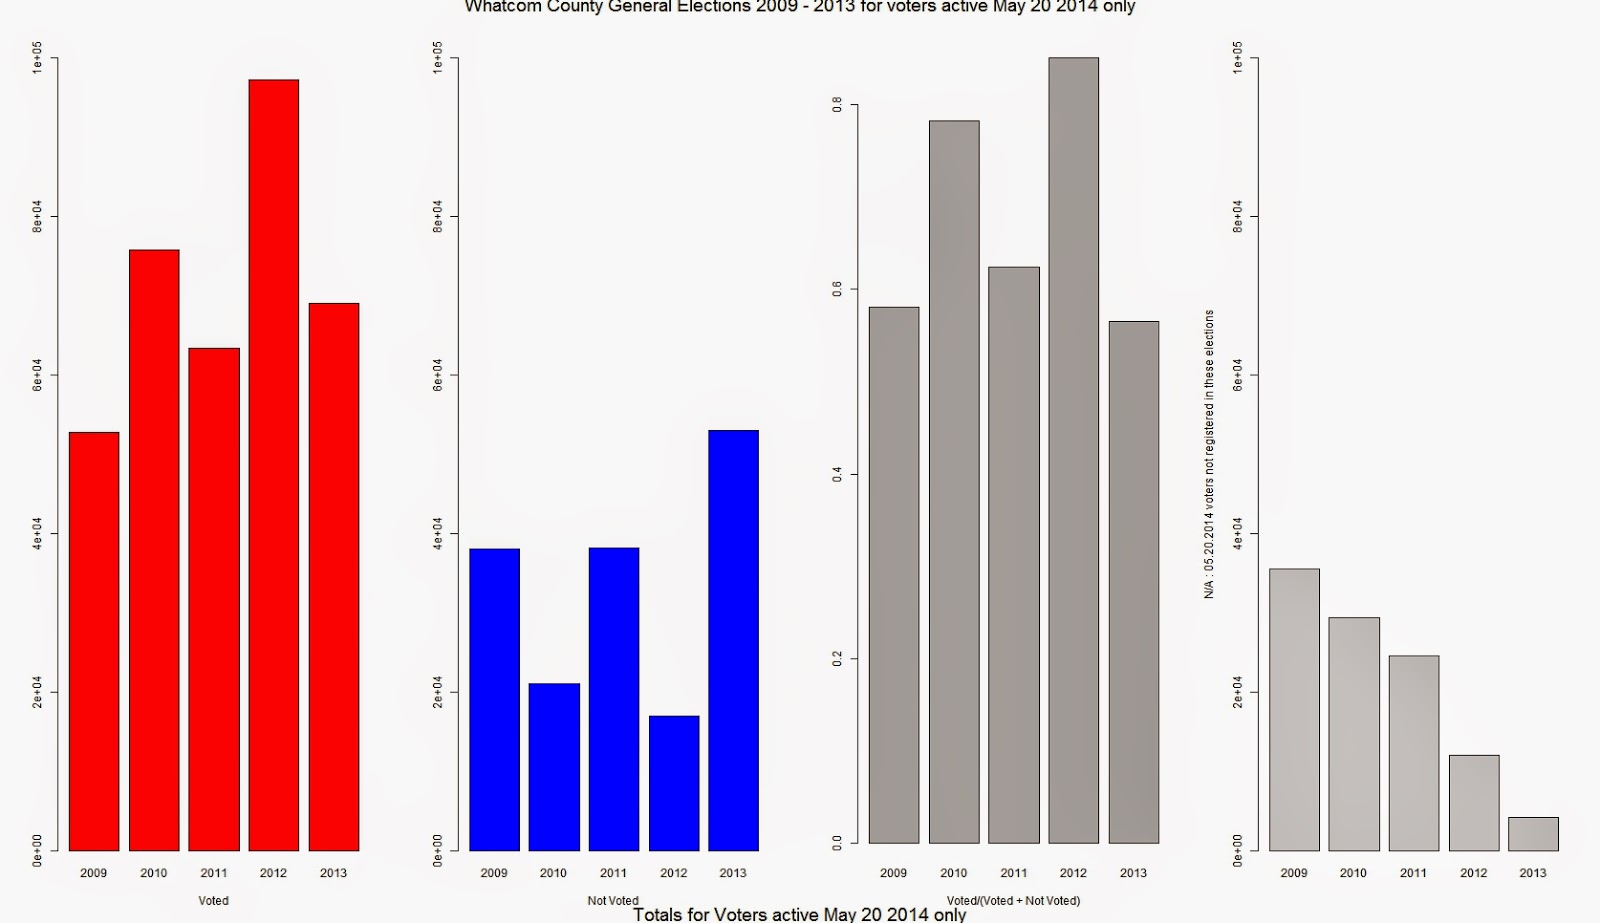 |
| General Elections 2009 - 2013 for voters registered as of May 20, 2014. |
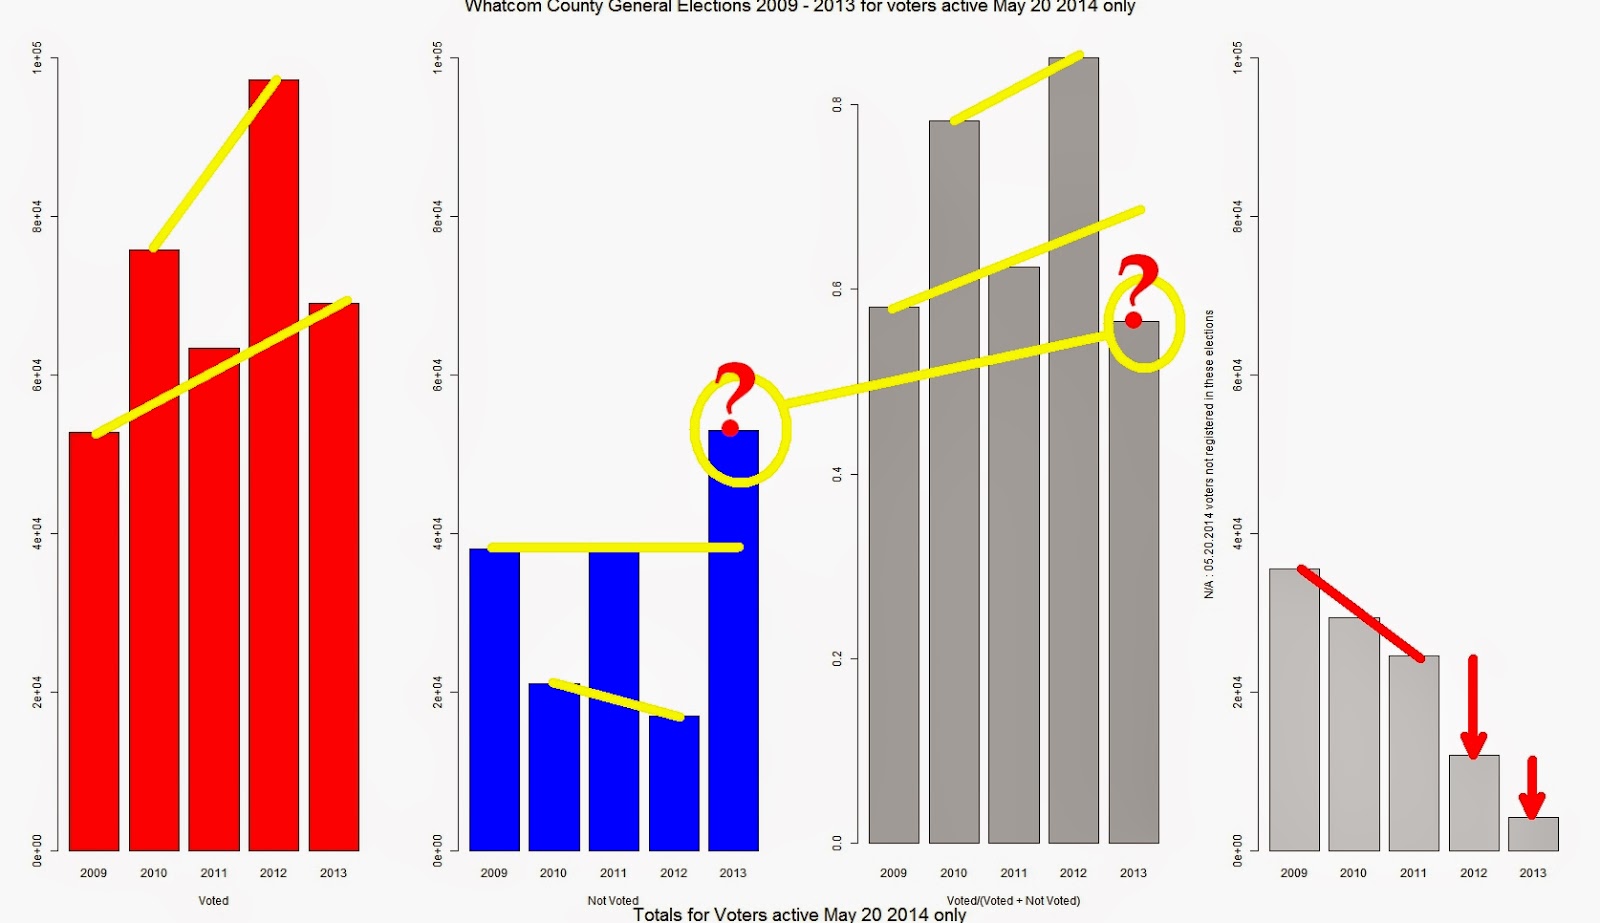
Above, I've highlighted in yellow the patterns and anomalies I can visualize. From left to right:
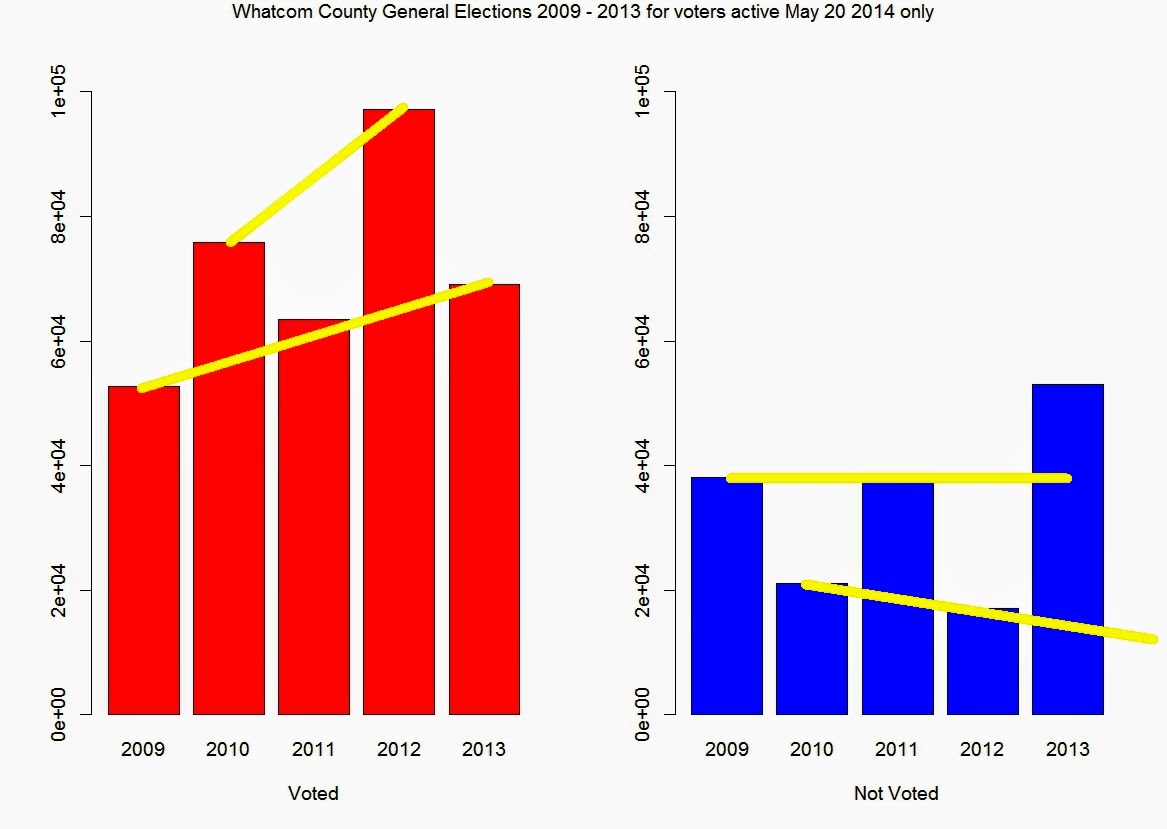
- Chart 1 shows votes increasing at different rates for odd vs. even (major vs. minor) election years.
- Chart 2 shows consistency for those not voting in odd and even years except for the 2013 election where there was a marked increase in registered voters not counted (e.g. "not voting").
- Chart 3 gives corresponding percentages of those did vote (turnout).
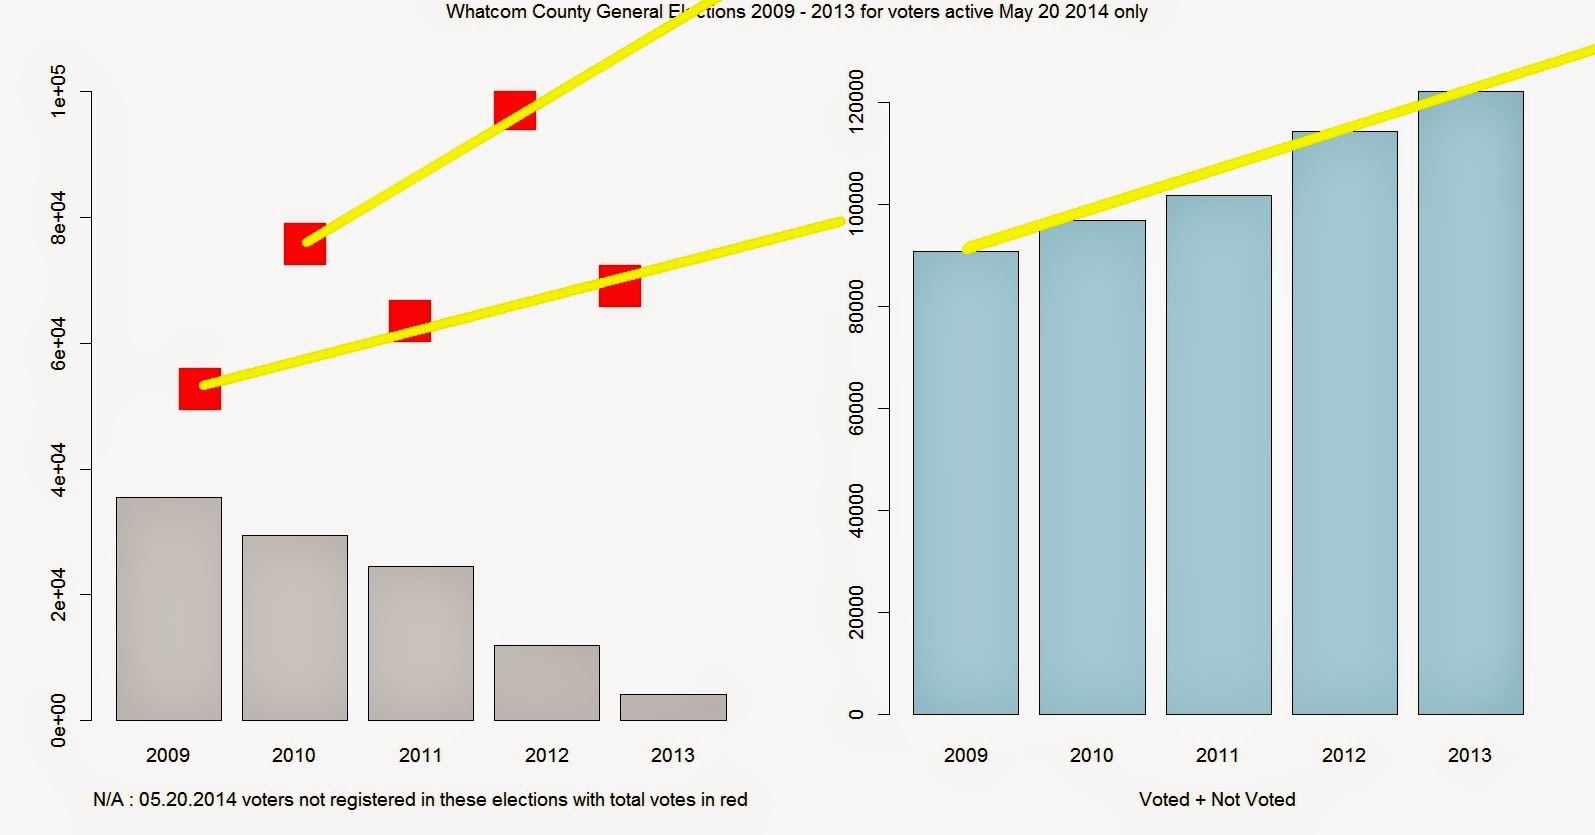
- Chart 4 shows those from this active voting list not active (registered) in previous years.
No comments:
Post a Comment